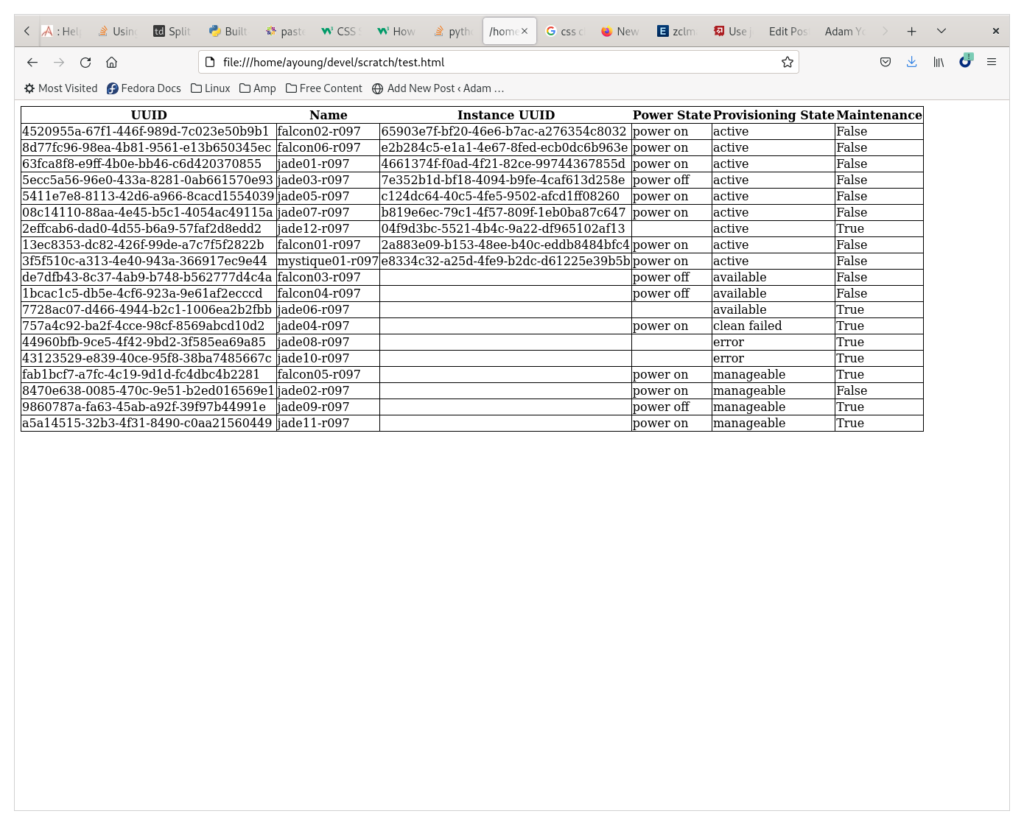
Enough of us are looking at the cluster that I want an easy to read snapshot of the node state. So, I convert the csv output of the openstack command into a simple HTML table.
Yes, there are many other better ways to do this.
This one steps over the line for a simple tool. Ideally, it would just perform the csv to table part, with no style or HTML body. But, for my purposes, it makes it much easier to visualize if I get some formatting.
#!/usr/bin/python import sys import csv first=True head= ''' <html><head> <style> table, td { border: 1px solid black; border-collapse: collapse; } </style> </head><body> '''.strip() print(head) data = sys.stdin.readlines() for line in csv.reader(data): if first: print('<table>') tag = "th" else: tag = "td" print('<tr>') for token in line: print('<%s>%s</%s>' % (tag, token.replace('"',''), tag)) else: print('</tr>') first = False print('</table>') print("</body>") |
Here’s what it looks like:

